Diversification and Asset Pricing
Covariance, Diversification, and Beta
the idea of covariance when you have two separate stocks, for example. Okay. All right, I'll try to start keeping things really simple. There's two stocks that we're looking at. Two different companies. They're both startups, and they're both trying some risky new venture, and they both, it's like a coin toss, right? They both have a 50, 50 chance of succeeding.
And if they succeed, they're worth a million dollars, and if they fail, it's worth zero dollars. So we have two probability distributions, one for the stock one, right? This is 1 million and this is 0 and this is 0.5. I'll leave it at 50-50 for now. And this is stock 2, 0.1.5. So it looks the same. Now the question is, are these two businesses really independent?
We've shown they're probably. of succeeding. But if I'm going to invest in both of them, as a smart venture capital firm might do, what do I make of that? Are they the same or different? So let's say the mean is 0.5 for both of them. It's like a fair coin toss. All right? And so they'll deviate either plus 0.5 from the mean or minus 0.5 from the mean, both of them.
Now, but the question I want to know is as an investor, are they going to do the same? Or are they independent of each other? There's four possibilities. The covariance, COV, covariance between the two returns is a probability weighted average. Now it's analogous to variance. but it's between two companies. So let's consider that what's the first possibility?
They both succeed. So it has a 0.25, 1 and 4 chance, of being a half above the mean for both of them. So that's 0.5 times 0.5. Right? And then it has a 25% chance of both being 0. So it's 0. 25 times minus 0.5 times minus 0.5. But then there's the chance that one of them succeeds and the other one doesn't. And that has twice as like, that has a probability of 0.5 because there's two different ways it can go.
Right. It could be A that succeeds and B fails or otherwise. So we have 0.5 probability of minus 0.5 times. 5 times 0.5. So what does that add up to? It adds up to 0, right? Because these are both positive numbers. And but these are one, so the product, minus 0.5 times minus 0.5 is plus. And so this is equal to a half times a quarter, right? The two terms here.
Right. And that's the same here. with a minus sign. So it cancels out. So if they're really independent like that, then the covariance is zero. And we like that as investors. We don't want to get in trouble. So we want to see an independent investment. But on the other hand, it could be that the two companies are really the same. They're really betting on the same idea.
And so these are not possible. all right? This probability goes from 0.5 to 0. And then this probability goes to 0.5. And this probability goes to 0.5. I see. So now we have a covariance of 0.25. It's not zero anymore. And that's a flag that there's danger here. And the other possibility, another possibility, is that they're exact opposite of each other. One will succeed if the only one of the two will succeed.
One will succeed in the other fails. And that would be a negative covariance. So these things matter and they become central to our theory in the capital asset pricing model. You really, this is something that's not in the habit of thinking of amateur most amateur investors they look at their investments one at a time yeah and they don't but they you always have to go back and say what's the covariance it's that's what really matters for what happens to your portfolio because when you you invest in a lot of companies that are all the same you're asking for trouble because it's the whole thing is going to either blow up or succeed and you can't live like that you have to be looking for
low covariance. And the formula, the theory of capital asset pricing theory tells you how to take account of covariances. Okay, so then really this covariance kind of changes based on how we assign the probability of each pair of outcomes occurring. So what's the probability of them both succeeding? Here we put 0.5. And then what's the probability of them both failing, which is like zero and zero, so that would be 0.5.
And we gave no probability to the case where one succeeds and one fails. So that kind of, the fact that the covariance is positive is kind of indicating that these two stocks tend to do this, they move in the same direction. They're kind of simultaneously moving in the same direction. So this is what, this is the basic bottom lesson. Risk is determined by covariance.
Right. Especially if you hold a large number of assets, idiosyncratic risk just doesn't matter. It all averages out. It's this kind of thing where they do the same thing that you have to worry about. And this is a basic lesson in finance. It just doesn't come naturally to most people. You have to ponder this. So that's really interesting because when we come to finance, most people think of that risk is just the variance possibly.
But actually we're saying it's actually more granular than that. It's actually the covariance of a stock with, let's say, the broader market. Right. Well, yeah, because any investor has the option of investing in everything. Right. Because there are mutual funds that will do that. There are world funds that put their money all over the world. And so why shouldn't you do that?
Well, it sounds like it's a pretty good thing to do, actually. Because they're getting... But the one... thing they can't get rid of is the market risk for the whole world. That's there because you, no matter, if you hold the whole world, you're still subject to the world risk. Right. But that's what an investor needs to be focused on. And this is a bad habit among many individual investors.
They just look at one stock and they think, I'm going to put all my money in that. Right. And they just don't consider how many different options for risk spreading they have in this vast world. that we have around us. Okay. And this idea seems very quite similar to when we were talking before about the market return versus Apple. And we... It is. So then we had different betas.
And so that's kind of getting at covariance. In fact, the beta of the i. Stock is its covariance. Okay. With the market divided by, oops, divided by the variance of the variance of the variance of the variance of the return on the market. It's just a scaled, a scaled covariance. Okay. And the average beta has to be one, because I could substitute the average return on the assets, and that's the return on the market.
So then the covariance of anything with itself is equal to the variance, which is eight equals one. Okay. So then, you know, if you're more than that versus less than, I see. Okay. So you want to be careful. In other words, the basic CAPM says that the market demands higher returns from high beta stock. That means high covariance with the market stock. And they're willing to take low returns if the beta is low, because that means it's less contributing to risk in the portfolio.
In fact, if you can find a negative beta stock. Or let's say gold, it may not always be negative beta, but let's say in theory it's negative beta. Putting gold into your portfolio, it has no return at all. It doesn't pay dividends, nothing. Right. But it moves opposite your other investments. That's the theory. Okay. And everything that we're talking about here, we have this presumption that we're all risk averse.
And so I just wanted to state that that's a, that's a key. part to why we care about covariance. Yeah. But if there's somebody like George Soros or Warren Buffett, maybe they're less risk-averse. Well, I have no fundamental insights into either George Soros or Warren Buffett. My guess is, though, that they have this theory firmly in mind, and they may want to take risks at times.
See, the real world is not so cut. and dried, as I showed here, but we know the probability of everything. So they may disagree with other people, and maybe they're smarter. Maybe they work harder. Right. So they won't always minimize their risk. The CAPM model is abstraction and idealization. And it assumes that there are well-defined probabilities for everything.
But in fact, I don't think anyone behaves entirely in accordance with this model. I'm thinking of it as, it's actually a fabulous model as a first step in thinking about financial markets. Because it can prevent you from making a lot of mistakes.
Do Not Put All Your Eggs in One Basket
I wanted to talk about an alternative to insurance. It's the idea of managing risk not through purchasing an insurance policy, but through diversification, through owning a variety of assets. And here again, we're going to start by assuming a blank slate. You as an individual have no risks that are inherent to you. don't live in an earthquake. though, we're not going to worry about that.
But you do have to take on risks in order to get investing, good investment. So the idea is that risk is inherent to investing. Ultimately, people who are providing you with investment opportunities are doing something in the real world, which is risky. And if it weren't risky, it wouldn't be giving you an extra return. That's the core idea. that we want to develop.
And that you have to manage your risk by diversifying across a number of different assets, not putting all your eggs in one basket. So that's the core idea that we want to develop today. So I said, put your eggs in one basket. I was wondering, you've heard that term? Don't put all your eggs in one basket? There's a variant on it. Who said, put all your eggs in one basket?
and watch that basket. That might have been Mark Twain. I have to look it up. But more famous is don't put all your eggs in one basket. So I tried to search out, where did that first appear? And I found it in a book by Alexander Trump in 1874 about how to invest. And then he says, there is an old saying that it is unadvisable to have all your eggs in one basket.
So he doesn't put it. provide, he doesn't provide a reference for his old saying. But that's the earliest reference I could find for it. I like history of thought. I always wonder where it comes from. The portfolio theory approach describes everyone as the same. We don't have risks that have to be insured, or we've already taken care of them, any specific risk.
I've bought an insurance policy and it's gone. So that's the assumption. So what if I calculate it? So what if I calculate the optimal portfolio, the best diversified portfolio? The core insight of this theory is, you know what? It's going to be the same for everybody. I mean, if I can sort of quantify risks and returns and I calculate the optimum, then why is it different from one person to another?
Well, you could be different from another person because of, you might be more risk-averse than others. You might have a greater, or lesser tolerance for risk. But that variation in tolerance to risk could be adjusted by leveraging your portfolio up and down. So if you abstract from that adjustment, you know, really everyone should be doing the same thing. That's the key insight.
So all that should matter to you as an individual is the performance of your whole portfolio, right? If you are a rational economic person, an econ, as they call them, why do you care if one stock goes up or down? It's the total that matters to you. So what you would naturally care about is the mean and variance of the return on your whole portfolio. And you just don't care about what one asset or another does.
Now, in fact, people boast about their investing skill with regard to individual assets. But they shouldn't. Because you know, you win some and you lose some. It's the average that matters. So you care about the average return of your total portfolio and you care about how uncertain the total return of the whole portfolio is. We are talking now about the capital asset pricing model which I think it's due to Harry Markowitz in the early 1950s.
He was a graduate student at University of Chicago. He had this neat idea. I can write down how to optimize risk. I'll assume risk can be described by a variance matrix, a little bit of technical apparatus and statistics. And I suppose I know what the expected returns are on various assets? What should I do as a portfolio manager? And it was simple like one page of math. He wrote it all down. It computed the optimal portfolio. And assuming that you know the variability of assets and their expected returns, it kind of amazes me that it wasn't known before.
But, you know, there are moments in history when certain ideas suddenly crystallize. The idea of measuring risk by a standard deviation. And then doing some calculations that bringing that down, maybe to a minimum value or minimum compared to some expected return. That led to a big revolution in finance. So, but it's a mathematical discipline. the discipline that we saw in class.
I also think it can be overrated. I love mathematical models like that. But they're not the whole story either. But the idea is that somehow you have to take account of each asset that you invest in, how does it contribute to your overall portfolio variance and portfolio expected return? And there's a lot of complexity and a decision. Sometimes you want to hold a positive amount of an asset.
Sometimes you want to hold a negative amount. And what you hold depends not just on that asset's expected return, but on the expected return of other assets and their covariance with this asset. It all sounds impossibly difficult problem, but it really isn't that difficult. It's simple calculus. Harry Markwitz. just worked it out in his room at the University of Chicago, and it's with us ever since.
So that was one thing I wanted to cover early in the course, because I just like the model. I don't trust it either, but I like it.
Risk Salon: Hedge Funds, Systemic Risk, and Human Lives
I was wondering how these large head funds and their ability to take on large amounts of risk and leverage themselves, how that affects the market. Well, hedge funds are investment companies that are not approved for the general retail market. So they're not allowed to advertise. They're not well known because they're not allowed to promote them. except through private conversations.
And to invest in them, you have to be an accredited investor, not a general investor. So they are allowed to do sophisticated and dangerous things. The idea is a hedge fund is regulated for people who have professional advisors or family offices. You know what a family office is. If you are really rich, You don't just hire an advisor. You get a team of advisors who, that's their whole job, is to work on your family investments. That's what hedge funds are really for.
So they're dangerous because they're not, you know, it's like taking drugs. You need a physician to, between you and the drugs. So often in the past, hedge funds have done really well. In recent years, they haven't been doing well, on average, for the most of them. So I don't know that I recommend them. I can't recommend them as a group. But if you have a family office?
I assume we don't. If your family office recommends it, go for it. but if you've selected them carefully. But they just represent the most, claiming to be the most sophisticated investors. And another notable thing about hedge funds is that traditionally they pay very high rewards to their investment managers if they are performed. But that comes out of your pocket, and there are skeptics of hedge funds saying, I would never pay those high management, those expenses to the people who invest my money.
Because nobody can deserve that amount. And so hedge funds in a sense are, at least many of them have been a bubble in themselves. They were doing well for a while. The impression was they were doing well. Lots of people piled into them. And lately they haven't been doing so well. I guess really did, like these big financial institutions can take on a lot of risk and the risk that they take on has the potential to cause massive financial crises.
Should there be a way to like regulate this risk or how much of this risk should be regulated versus how much is it important to the inherent way that these institutions are done? Yeah, well, I think that we are in a situation where we've had heightened recognition of the importance of regulating for dealing with big risks, that systemic risks. So a systemic risk is a risk that the whole system will collapse, like a house of cards, some people say.
Regulation, before 2008-2009 crisis was mostly micro-prudential. That means they wanted to make sure that you as an investor weren't being ripped off by this stockbroker who was squirreling away your money or doing something like that. They were thinking of you as an individual. But we've now had new impetus for macro prudential regulation. And it's now regulation about how interconnected are you with other, or some big business connected and what will happen if that other business fails to this business?
So we want to, or if there's a world financial crisis, how will this business fare? So since the 2008-2009 financial crisis, we've seen a lot more macro prudential regulation and a lot more measures of risk that are being developed. There are now what we call stress tests of financial institutions that emphasize more of their interconnectedness and how they would fare in various kinds of international crises.
What are some measures of risk, I guess, post-2008 crisis now, that are more appropriate to measure? Well, yeah, well, there's a, that's a controversy. Before the crisis, there was regulation. It's not new. And there was some concern with macro prudential. For example, before the crisis, there was a method called value at risk. that was used to measure the risk of a company by looking at the assets and liabilities of the country company and considering what the probability of a big correction and the values would be and what it would mean for the company.
But after the financial crisis, we now have more elaborate assessments of macro risk. And the stress tests will consider what the government regulator will specify that the financial institution should estimate how it would be affected by various kinds of financial crises. So it's getting more detailed and more effort is being put into it. That's because the 2008 crisis caught us all off guard.
And people just didn't know how interconnected banks and other financial institutions were. And they had to act in ignorance as a guess because too much of their data collection was micro-pudential. I have one more question. Yeah. It's about going back to the idea of measuring risks. So in class you mentioned, Nassim Taleb's idea of the black swats, right? And he said that all these models to measure risk are, if you read his book, are fundamentally flawed, because they don't take into account this super, like, improbable events like a black swan.
In a way, you could say that the financial crisis in 2007 was one of those. events. So do you think there's ways to improve this model, to take into account more unlikely events like this black swan? So the method is fundamentally flawed to take into account. Right. So you're referring to Nassim Talib who had a book called The Black Swan that talked about rare, low probability events as being sometimes really big.
So you could work a lifetime creating a, wealth under certain assumptions that something can't happen. And then bang! You've lost everything for your whole lifetime because you thought it couldn't happen. That's kind of what happened in the finance, in the recent crisis. People thought that home prices can never fall because they never have, or they never have since the Great Depression.
And so, I know that's a perfect example, but it's a perfect example, but it, This is hard to deal with academically. If you're talking about rare, big events, well, you don't have enough data on them because they're rare. So it's a problem. So, yeah, so things that happen in the market, this is what efficient markets people sometimes say, that the markets have to deal with the probability of these rare, big events.
But they're so interesting. They're so intangible and they're just something that I can't quantify. But when the market goes down, Eugene Fama might say, when the market goes down, don't just assume it's crazy. Maybe it is some subtle evidence about some big event that could happen. So I've got to give it, that is a possible interpretation. We just never know.
I wish there weren't these big black swan events. Finance would be so much better. a profession to be in. Unfortunately, we live in a real world. I shouldn't put it like that. We live in a world with the risk of huge events. So, like we have so many risks in our life, like as we said, if you go into a labor market during a recession, or basically if something bad happens, like you need to find a way to hedge it.
We have stuff for, like hedging against oil risk, for agricultural risk. Are there any innovative financial products or hedging against, say, labor market risks? Well, I'm glad you asked that question, because this is a theme of mine for a long time, that we should have labor market risk. Now, we do have something. Unemployment insurance was started in the United Kingdom, I think it was 1911.
The idea is temporary assistance for finding a good job. Now, they realized there in the UK, that people often are desperate when they lose their job, they have a family, and often people know no savings. So what the person does is takes what has to, right, take the first job offer, and it's often not a very good career track for them. And so it's hard for them to move to another job.
So let's give them time, let's give them maybe six months of support so that they can find the right job. and also give them some kind of help in finding a job. They'll have a career service for them. That's an old idea. The question is whether we can do more. The unemployment insurance is really focused on finding a job in the short run. But now there's a problem that we're seeing inequality grow in many places around the world, and we see a lot of people who are complaining differently that often, it occurs when they're middle age, say they're 50 years old, and they lose their job.
They suddenly find themselves at a, I mean, they can get some job, so unemployment, but they can only get those bad jobs because somehow people want to hire young people and they'd have to be retrained and someone doesn't want to retrain them because they might not stay as long, so they have a problem. So one idea, I call it livelihood insurance, This is kind of a futuristic idea.
But it's not just, there was Laurie Klutzer and Robert Leiton, another couple of economists, wrote a paper about 15 years ago. For the similar idea, they called it wage insurance. So the idea is when somebody loses their job and has to take a job at a lower wage, they should be able to collect on an insurance policy. Interesting. Interestingly, President Obama brought this idea up during his State of the Union address for 2016.
So the President of the United States appears behind this idea. Unfortunately, a lot of ideas that President Obama has been behind don't happen. But the other thought of it, he was proposing to be some government insurance. I don't see why it has to be exclusively government. There could be private insurers or private market. or private markets that would help protect people against the loss of income.
But I think it's actually very important now, more so than in the past, because of the rapid increase in information technology and robotics and the rapid globalization. So things can happen really fast that make one's investment in human capital obsolete. And absolutely, there should be risk management devices for that. And the important thing, as I've argued in my book, is if you help people manage risks, they will take more risks.
That's what we want. people in their decisions about their education to do some risk-taking, develop some specialty that is at risk of being obsolete. But who knows? Nobody knows. You're taking a chance. Let's encourage people to take chances.
The Capital Asset Pricing Model and the Market Portfolio
The capital asset pricing model. It's a model of the optimal portfolio. It asserts that all investors will hold the optimal portfolio. So anyway, I showed you last time a scatter diagram which had on the horizontal axis, the return on the stock market, and on the vertical axis, the return on Apple computer. And there was a scatter of points, one for each year, the return on the market and the return on Apple for that year.
And I had fitted a line through that scatter of points. The slope of the line is called beta. The idea here is that individuals should diversify. They should hold many different eggs in their basket. But diversification is difficult for individual investors. Partly because if you're a small investor, you'd have to buy fractional shares of each company. And, you know, the stockbrokers prefer that you do what's called round lots of 100 shares.
So you just can't do it. You're too small to diversify. So you need some company to help you diversify your portfolio. So the idea has been, going back many decades, that people need investment funds to manage their portfolio for them. And the investment. funds can diversify optimally for them. So before the 1940s, we had what were called investment trusts.
Later, they became in a different form called a mutual fund. The first mutual fund is Massachusetts Investment Trust, MIT, not the Institute, in the 1920s. But they didn't really take off until after the 1940s. So a mutual fund or management company invests in your behalf in assets. And it's mutual in that it doesn't skim off profits to a class of stockholders.
It's divided up equally among all the people who invest in the mutual fund. But a mutual fund puts together assets, hopefully in a diversified manner. So Now, the question of whether we're really talking about complete diversification or not. Often when we talk about the capital asset pricing model, or I should say usually, it is assumed that we're diversifying across all stocks, and maybe all stocks and all bonds.
But in fact, if you wanted to be completely diversified, you'd want to include other assets like real estate or commodities like oil as well. I put this up because I, had to take an exam to get licensed as a stockbroker at one point in my career, because I had a company. And it turned out I had to be a licensed. So I took the exam to become a stockbroker. I never was a stockbroker in my life.
And the exam study materials, this is Series 7 exam that some of you might end up taking if you go into finance, they talked about class classifying all the day different investments that someone might make in terms of risk. So there's low risk, moderate risk, moderate risk, high risk, and speculative. Now they have an image of mountain climbers climbing to the top.
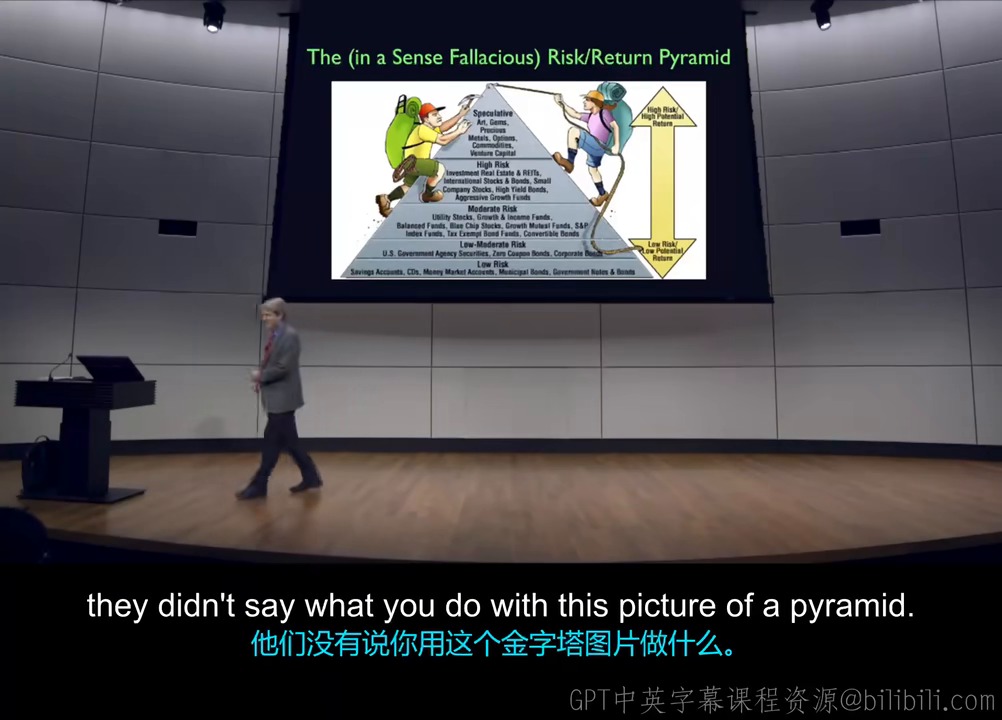
Now they didn't say what, I had to memorize this for the exam. Something didn't bother me about it, though. They didn't say what you do with this picture of a pyramid. So it sounds like looking at the picture, like, we are supposed to be climbing up to the most speculative investments? I don't know. But what I thought is, there's nothing wrong with this diagram, but somehow it's misleading.
What CAPM says, doesn't matter what your risk is, you want to hold all of these. You'll average out to be the best for you. So speculative, art, gems, precious metals, options, commodities, venture capital. I want all of them, okay? Do you want these two? Yes, I want all of them. It's very simple. It's not like going to a candy store. You probably just buy one piece of candy.
You walk into the candy store and say, give me one of everything. That's what you should do. Now, if you look historically at different asset classes, you find historically they have paid different amounts out on average through time. Jeremy Siegel, who is my old friend of mine at the Wharton School, has just come out with the fifth edition of his book, Stocks for the Long Run.
And he calculates the average return on the stock market in the United States from 1802 to 2012. That's 210 years of data. It's a lot of data. And he finds that correcting for inflation, The real inflation-corrected return, on average, for those 200 years, was 6.6% a year. On the other hand, the geometric average real short-term government return was only 2.7%.
So the equity premium. Equity means. stocks. The premium of stocks over short-term saving vehicles, on average for 200 years, was 3.9%. So then he poses it as a puzzle in the beginning of his book. How can that be? That's 200 years is a long time. I'm thinking everyone, this is your first thought, should invest in the stock market. Why does anyone invest in short-term governments.
So this is called the equity premium puzzle. How can it be that one investment has done so much better overall for 200 years compared to another? And that's what we're going to try to understand with the capital asset pricing model here. It's not just for the US, but not as dramatically. Will Getsman said that to some extent the US equity premium is a problem of, reflects a selection bias problem.
The United States is the most successful capitalist country in the world. You might argue. Someone might try to argue otherwise, but if we're not, we're pretty close to it. So looking at the success of stock market investments in the United States is misleading. So you might say, let's look at another country. How about Russia? All right? Well, let's think.
Whatever happened in the United States. in Russia, if we're taking it along from 1802. You know, I kind of remember there was something called the Bolshevik Revolution. So basically, it was wiped out. You didn't get anything. So they're not uniformly a good example. But at least in the U.S., it seems like, now we may be making a fallacy in assuming that this is God's law that stocks outperform other investments, but it seems like they have been.
then. So do you think that using historic data or expected return is really helpful? Right. You're getting at a basic issue. What do we know about the future? And does the past have any indication of the future? Big question. So let me give you an example. Utilities stocks. That's electric companies, gas companies. They, they, every month, they keep the lights on.
They've been doing this for a long time. So they're boring stocks. And they'd hardly ever have gone bankrupt. So people think those are safe stocks with a low beta or a low idiosyncratic variance. And maybe they don't pay the highest return. Now, and so that would be, supported by data for the last 50 years that they've been boring investments. So it almost seems reasonable, doesn't it, that they're going to continue?
What's exciting about them, you know? But on the other hand, if you look at the history of, I'm just bringing up utilities, they weren't always boring, particularly the 1920s, when the world was becoming electrified and electricity was new. and these lights were exciting. You switched, in fact, this is an old room. I think you can still see the gas lights. I don't see them.
They removed them. This was obviously lit by gas when it was built, not by electricity. Once the electricity, the electricity is so much brighter and impressive, so people were excited about it. So in 1929, the sector that grew the most when crashed was the utility sector. So that means you can't necessarily trust past behavior of stock prices as an indicator of the future.
I think that it's kind of halfway. You can sort of trust it. If you know a reason to think otherwise, then you wouldn't. But when you get to other things like Facebook or Google or whatever, or alphabet, What do you think about their future return? Is that predicted by their past return? And see, now we're, who knows, right? It's changing, everything's changing too fast.
Beta Revisited: Regression Slopes and Idiosyncratic Risk
All right, let's give an example of a scatter diagram. And I'm going to pick an example that compares the return on the stock market or the overall market of all investable assets with the return on an individual stock, let's say Apple Computer, which I just picked because it's the biggest company in America. So let me just draw on the horizontal axis the return on the market.
That's everything you could invest in. Let's just imagine all stocks put together. And then on this axis, we're going to put the return of Apple. And each point represents one year. So let's pick a year when the stock market went up. Let's say the market went up 10%. And what did Apple do in the same year? Well, let's say it did 15%. So I make a point here that, a point above 10%, and at 15% here.
Okay? Now, in some years, the market goes down. Let's not forget that. So here I'll say there was another year when the market did minus 5%. Okay? What did Apple do in that year? Well, let's say Apple did minus 10%. So I get a point down here. You see this? is minus 10, and this is minus 10. minus 5. Okay. So I have a point down here. Okay. And then I can fill in many years, each year is a point.
And this is a scatter of points. I've got a lot of years shown. And now when you see this, and some of them are negative, or close to zero. When you see the scatter of points, you say, well, I'm starting to see a relationship here. That there's an upward sloping relation. There's a positive relation. between Apple and the market. And I can draw a line that's the best fitting line through the scatter of points, so that it kind of gets as close as it can to the scatter of points.
That's called a regression line. And the slope of the line is called its beta. If it has a slope of one, that means the stock is reacting one for one with the market. But in the case of Apple, the beta, is about 1.5. It's greater than 1. The typical stock will just go one for one with the market, but this is a high beta stock, so it's reacting more strongly to the market.

And so I see. So then the 1.5, you can see as if the return of the market goes up, the S&P 500 goes up 10%, then you should have 15% for Apple, which gives you the beta. 1.5 on average. Right. Well, it won't be exactly. It doesn't fall exactly on the line. But they differ from the line, and that's called idiosyncratic risk. It's not related to the market. I see.
It's Apple risk. So the market could do great in one year, and Steve Jobs could get sick in that year. You know, it's just something. And so Apple didn't do well. That's idiosyncratic. The theory of the capital asset pricing model is that investors care more about beta than they do about idiosyncratic risk. Because all those companies idiosyncratic risk will average out and won't matter.
What matters is the systematic risk, the risk that correlates with the market. And those things don't average out, no matter how many stocks you put in your portfolio. I see. And so is there any particular reason why some company, X would have a high beta versus another company having a lower beta? Well, I think one reason, there may be many reasons. It's not just a, this theory doesn't tell you why.
Okay. I'm just adding some thoughts on that. Right. One reason why Apple computer might be a high beta stock is that it takes, it invests in projects that are iffy that nobody's done before. And their success depends on the state of the economy. So if they launch a new iPhone at a time of a severe recession, they're not going to do well. And the other thing that can make for a high beta stock is that the company borrows a lot of money.
And then they're playing on the edge because they have to make a lot of money or they go bankrupt because they've borrowed so much. Apple is not in that. category. Apple has not borrowed a lot of money. It has, in fact, a lot of saving. That's something that brings its beta down. But Apple is such a lively company and so connected with what happens, that their beta is still 1.5.
I see. And so then a counter example to this might be if there's a very low beta stock, so that would kind of look like either a lower slope or even a negative slope. Right, right. So for example, gold might in many cases be a negative beta stock. Why is that? Because when the stock market crashes, people panic and they get upset and they want to hold something very safe.
At least gold is always safe in one sense. It stays gold no longer, no matter what happens. It's also something that you can run with. You know, if you think that you're going to be a refugee, I want something I can stash in my personal. in my purse and just get out of here. Gold has that aspect. So it's some psychological fact that at least in some time periods it looks like a negative beta asset.
So I think that would look like this. You have a scattered diagram that looks like that. It's backwards. And you fit a line and it has a negative slope going down rather than up. Okay, so that means that when the market is doing well, when the economy is doing well, gold might not necessarily be a great option in terms of returns. But then when we have a recession, that's when you see returns highest for gold.
So. Yeah, and when constructing a portfolio, it matters. Negative beta stocks help you in a different way. Maybe their return isn't so good on average, but they help offset market shocks. So you like to have, other things equal, you'd like to have negative beta stocks in your portfolio, as long as their return isn't so bad as to offset the advantage of their beta.
The Security Market Line: Only Beta Earns a Risk Premium
Now, we're talking about the security market line, the basic, the most impressive conclusion of the capital asset pricing model in finance. It is a relationship between the expected return on an asset and its beta. So what the equation says is that the expected return on the Ith asset is equal to the risk-free rate. expected or actually it's the same as the expected because it's known with certainty plus the beta of the Ith asset times the return expected return on the market minus the risk-free rate.
So that is the most famous equation. What it says is that this is a consequence of two things. The theory of forming an opportunity optimal portfolio, which we have already discussed, also the assumption that everybody does it. Okay? Now that second assumption has always bothered me, but let's go with it for now. We're talking about a world in which everyone has a smart money manager who looks at variances and co-variances and figures out.
Then in that world, it should be that this equation holds. Some assets have a higher return than other assets. Does that mean that investors were stupid who invested in the other assets? Absolutely not. The higher return is associated with higher beta, which means more risk. And I've just, we've just derived what the smart investor would do. And the smart investor would do. And the smart investor would hold all of the stocks, all of the assets, whether stocks, bonds, and real estate, everything gets held. And not everything has the same predicted return. You can predict that some will earn more than others. But it's always because of higher beta. So let's think about this. Some assets
have an expected return, which is less than the riskless rate. Those are negative beta assets like gold. And so you say, well, why would anyone be so stupid as to invest in gold when it has a lower return than the riskless rate? And the answer is, it's not stupid at all. The negative beta is helping reduce the overall variance of their portfolio. Because gold goes up when the stock market goes down, it offsets other risk.
And there are other assets like Apple Computer, we can look back and say, wow, it had a really high return. over the last 20 years, was I a fool not to put all my money in Apple? No, you weren't a fool. You did exactly the right thing because you didn't know how the risk outcome would come. You may know that it has a high expected return. But Apple is a, is, if you trust the beta, it has a high beta, it's plunging. It's a risk, it's a stock that won't help you in a stock market crash. And it will offsetting that, it will really, help you a lot in a boom. So this is a description of a world in which everybody is holding the tangency portfolio. We're not enticed by Apple. We're not scared off by low return assets,
but it all fits a model of looking at beta and adjusting your portfolio so that you have the optimal mix. It's kind of a complicated theory because it involves, this tangency portfolio, it involves thinking about leverage, it involves thinking about how things move together. But it is really the core idea in modern finance. That isn't mean to say that it's absolutely right. It's not absolutely right. It's only a half truth. The problem is that not everybody is holding the optimal portfolio. We don't all own the same portfolio of risky assets.
world isn't quite consistent with this. But I think it is a very useful exercise to think about an idealized world where this holds. Is it fair to think of a stock that has a negative beta as being like an insurance, playing an insurance kind of role in your portfolio? Absolutely. A negative beta stock moves opposite other risks. So you may own Apple computer as an element of your portfolio. But, you know, it doesn't have to work out well. Even though ex ante, the Apple computer was run by brilliant people, history shows that there's risk in that. And so you want to have it in your portfolio, but you want other things in there as well. And what you really like are things like
an insurance policy against failure of Apple computer. Now, you could call that an insurance contract. You could also call it a credit default swap, which is another that you could focus that on a particular company. But yes, there is a, the concept of insurance is fundamental to the concept of finance. I don't know why they separate them up. They're really two different aspects of the same thing.
Okay. So earlier when we were talking about gold as being an example, I mean, a more, a very modern example is like when you mentioned the credit default swap, that's like a contract that is designed to pay out when the market is low. So it's a, okay. It's like a customized negative beta. Insurance is a different industry. It has different historical origins and it's regulated differently.
So securities in the United States are regulated by the Securities and Exchange Commission. However, insurance is not regulated by the federal government. It's regulated by the state governments. And so it's different people, but they're doing similar things. So really here, then, I can use this concept to think not only just about stocks and bonds, but really derivatives or any kind of asset class potentially.
Or you can think about, yeah, people make finance analogies to life's decision. So we're going to come up later about options, but an option is something you pay, for the option to choose later. Some people have said that committing yourself to marry someone is like exercising an option. So people who are hesitant to commit are just people who have the optimal exercise strategy for their marriage option in mind.
That's a joke, but it's not entirely joking. The same, the issues that finance covers are issues that are business analogues of fundamental risks in our lives. And so you have to, you can draw further insights from all of this. That also, I didn't mean to speak so flippantly about marriage. I've been married for 40 years. I don't think flippantly about it at all.
But there is some people who make analogies between business and marriage and other thing. And the analogy is the analogy. are not entirely off the mark.
Short Selling, Market Equilibrium, and the Efficient Frontier
If we were to compute the optimal portfolio, given the risk and return of individual stocks, how do we know that you won't want to hold negative quantities of some assets? So that's what's called a short sale. You can, in most countries of the world, you can hold negative quantities of a stock just as well as you can hold positive quantities. If you get one of those online brokerage service sites, you have to maybe sign up for a special account to do short sales.
But you can say, I'd like to short the stock. So how do you own a negative quantity of a stock? What it means is you borrow the shares and you sell them. Now you owe the share to someone else. The stock broker can help you do that in its very routine these days. Well, for centuries, it's been very routine. Most investors don't do it. So you could buy a negative quantity of a stock.
Why would you do that? Well, you would do that disregarding the CAPM that we're talking about. You might say you would do that if you think the price is going to go down. If the stock is overpriced, it doesn't look good. Instead of not buying it, I'll buy a negative quantity of it. Capital asset pricing model assumes that, yeah, you can borrow. you can buy positive or negative amounts.
Let's find the optimal portfolio. But then it turns out, however, that if you really take the idea to heart that everyone would do the same thing, no stock could ever have an optimal holding of a negative number because there would be a negative holding for everybody. And everyone would want to short it. And that can't add up. So we're going to allow short sales in our math, but we'll assume that they won't happen, not on average.
Here's why short sales won't happen. In our model, the optimal portfolio decision of all investors in equilibrium will be symmetric or identical. Given that, we can conclude that no single investor will ever short a stock in equilibrium because then everybody in our model would be shorting that stock, which brings up the question, who is providing the stock for you to this short.
So what I'm really coming up to is a kind of abstract model. And I'd like to talk about the real world, but the capital asset pricing model is a little abstract. So what it assumes is that everybody is rational. It assumes that nobody has any risks that are inherent to them. They all want to do the same thing, except for maybe a variation of leverage. They all want to do the same thing.
And so as a result, nobody will ever short a stock. Now this is an abstract model, and I have to apologize a little bit for it because there are short sales, but it's a model. And it's actually a very important model. By the way, the United States government has historically allowed short sales, but they were briefly abolished. The U.S. government got so scared that there would be a 1929-style stock market crash that it made a temporary law against short sales.
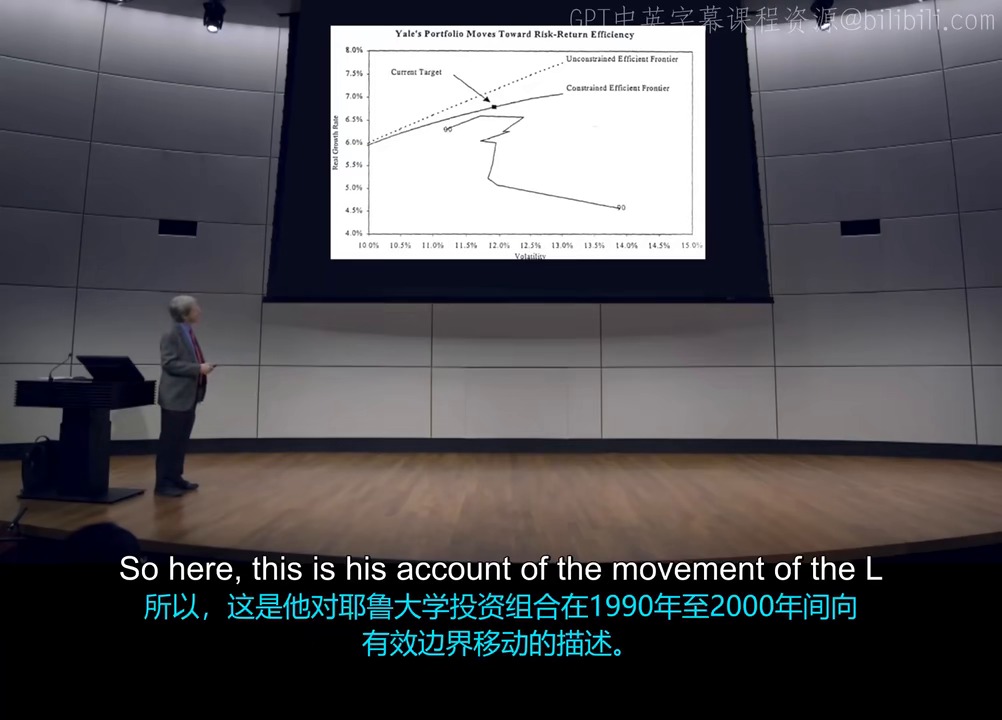
No one was allowed to short these 799 stocks. So we're going to develop a theory that puts no short-stale restrictions on it. We're going to assume that everyone computes, does careful calculations of the mean and standard deviations. and standard deviation of their portfolio return. And let's see what that implies. What it does imply is that there will be a optimal portfolio, and we should be on what's called an efficient portfolio frontier.
This, I won't explain that. This is from David Swenson's book about how he moved Yale to the optimal portfolio. When he took over management of Yale's portfolio, It was originally not well managed, and it was not optimal. So here it shows his account of the movement of the Yale portfolio toward the efficient frontier between 1990 and the year 2000. So we have scientific management of portfolios here at Yale.
So we'll come back to understanding what this is. So just a general question about investing. How are sort of unsophisticated middle-class people supposed to invest their money now with the interest rates so low? What is there to do? Like what can you people do? Well, interest rates are starting to go up, so maybe wait five years. Now, here's a fundamental issue about rationality and Most people are not financial whizzes, as your question implies.
And so what should we do? Should we have the government invest for them? But somehow there's something wrong about that too. Because the governments don't have a particularly good record of deciding on investments either. The United States has been an example of capital institutions going way back. We have had lively stock markets and other kinds of speculative markets.
People have lost money and have been taken advantage of over the years. But on the other hand, it produces an atmosphere of attention to business that produces a general culture of sympathy to business. You know, if you invest in businesses, then you'll be less likely. to vote for a strong man leader who will corral businesses. So the U.S. has set an example to the world about just letting some of these things happen.
So you've got this guy, Thomas Edison with these electric lights. He might be a nut, who knows, but some people invested in him. And there were other stories that didn't work out so well. But on balance, over 100 or 200 years, the U.S. system has looked pretty good and it's become spread. I mean, not just the U.S. is, but I'm saying that having free markets and involving people at large in some investing decision.
It has worked out well, even though it doesn't work out well for everyone.
Optimal Portfolios, the Risk-Free Asset, and Leverage
The capital asset pricing model is based on rational markets and rational investors, right? And what does it mean to be rational? And maybe could you explain what the saying means the market can stay long, irrational longer than you can stay solid? What does it mean to be rational? I'm married to a psychologist, by the way. You can ask my wife, we're economists.
We have a very simple model of people. But what does it mean to be rational? Sometimes I think rational people, they don't pay attention to financial markets at all. They're into more important things like making friends. But on the other hand, there is some basic, simple notion of human rationality that is, I think it's partly correct. People are partly rational.
But they often make mistakes. And this is something we're going to talk about in the semester of behavioral finance. is an important field. And we mostly think of ourselves, do you think of yourself as rational? Sometimes. I don't know if we have agreement on this, who's, who's, I never thought of myself as particularly rational. I have trouble with self-discipline.
Do you ever get lazy? Well, that's part of irrationality. Or do you ever find that you're just following entertainment. You're just bored with getting the facts. You want the entertainment? So these are human traits. The capital asset pricing model, the heroic assumption that is often taken uncritically, is that everybody is investing according to that model.
Now, on the face of it, that is absolutely absurd, because if you asked the population to describe the capital asset pricing model, it wouldn't be more than one in a hundred who would know what you're talking about to assume that they're just doing it is pretty extreme. On the other hand, I still like to go through the mathematics and see what would it be if everybody were extremely rational and logical, and how would the markets behave?
It's interesting. So let's just think about one risky asset and one riskless asset. Suppose I put X dollars into a risky asset one. Now, I'm going to invest $1 total. I'm just normalizing it on $1. So the money I have left over after I invest is 1 minus x. So I'll put that in the second asset, which is earning a sure but low return R sub f. So what is the expected value of the return on my portfolio?
Well, I have X dollars. in the first asset, so it's going to be X times the expected return on the first asset, the risky asset. And I've got one minus X dollars in the riskless rate. And so the total expected return is xR1 plus 1 minus x times RF. And so what is the variance of my return? Well, the variance is just equal to x squared times the variance of the return on the first asset.
So if X is 1, that means I put it all in the first axis, then it's just the portfolio variance, is the variance of the return on the first asset. What if I short it? I put minus 1. If I short it, that wouldn't be, it doesn't sound like a smart move, generally, on average, shorting the stock market, investing in the riskless asset. But I could do that. I could make x equal minus 1, and then I would have $2 invested in the riskless asset.
My portfolio variance would be the same, but I'd be on the wrong end of it, right? I would be, assuming that I've got my numbers right, I would be shorting the high return asset and investing in the low return asset. So, and having the same risk anyway. You can compute the portfolio. of standard deviation, which is just the square root of this portfolio variance.
So it's linear. The standard deviation of the portfolio is linear in the expected return on the portfolio. I can make the, see the real insight here is, I've tried to convey that last time. You want an expected return? I can give it to you. On stocks, on anything you want. But I'll do it by exposing you to risk. I can leverage you up. You want 100% expected return next year?
Great. I'll leverage you to the Hilt. And then you'll have that expected return, but you'll probably get wiped out because you've taken on two leveraged and investment. Let's illustrate the idea of how levering up to the Hilt can give you any expected portfolio return you want. Let's say you start with $1, and there are only two investable assets in the world.
Let's look at a risky asset. which offers an expected return of 20% and a return standard deviation of 5%. And the other asset is the risk-free asset which guarantees the return of 10% with no risk. If you want 100% expected return on your $1 portfolio, first borrow, aka short, $8 from the risk-free market and now you have $9 to play with. Invest all $9 in the risky asset.
This provides you with an account This provides you with an expected return next period of 20%, so your portfolio now has $10.80 on average. Pay back what you owe, which is 8 times 1.1 or $8.80. You're left with $2 in your portfolio and you have thus doubled your initial investment on average. Remember, though, you took on an 8 to 1 leverage ratio to get here.
Using the formula, the standard deviation of your portfolio, return was 9 times 5% or 45%. If the risky asset realized any return less than negative 2.2%, which is half of one standard deviation away from the mean, you would have had to file for bankruptcy. But we're not going to worry about being wiped out here. We're just worrying about what your return will be.
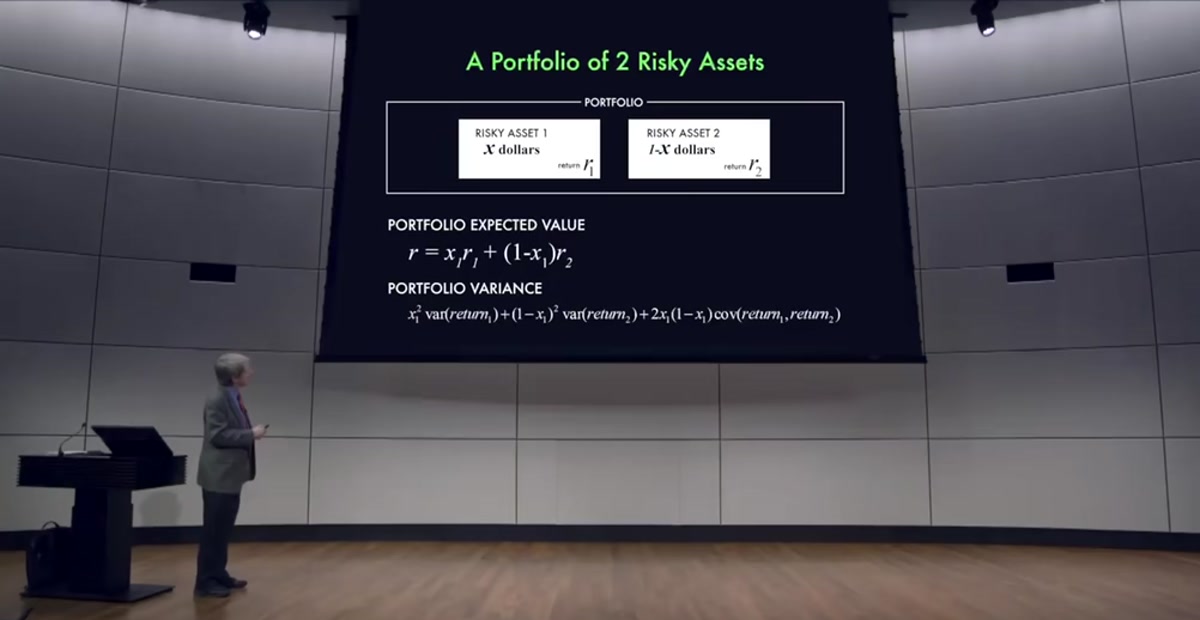
Now, suppose we move from just one risky asset to two risky assets. Now I want to put X1 in risky asset 1 and 1 minus X1 in risky asset 2. What is the portfolio expected return? Now I'm not putting anything into the riskless asset. So now I have two risky assets. The expected value of the return on my portfolio is equal to X1, which is the dollars I put in asset 1, times the expected value of the return on my portfolio.
return on asset 1 plus 1 minus X, $1. Now what is the variance of this portfolio? It turns out this is the formula. The variance of the portfolio is x1 squared times the variance of the return in the first one, plus 1 minus x1 squared times the variance of the return on the second risky asset, plus 2x1 times 1 minus x1 times the covariance of the return of the returns. Now the covariances matter because if they covary positively, that makes them interact in a positive way, increasing variance.
So positive covariance is bad for your portfolio. It raises the variance of your portfolio. Negative covariance is good. If you can find two risky assets that move opposite each other, or tend to move opposite each other, then they're covariance. then their covariance is negative, and this thing reduces the portfolio variance. What we're doing with the CAPM is we're moving beyond Mr. Crumb's day.
We now have statistics. So I'm imagining here that you are managing a portfolio, and you have historical data on the returns of the different assets that you can put into the portfolio. So you've calculated what the account expected return is for the first asset, the average, historically, for its return. You've calculated what the expected return on the second asset is.
You've taken an average. You've also computed the variances of their returns, so you know how variable they are, and you've even calculated the covariance of the returns. Now you might question whether covariances, variances, expected values that I estimated historically will continue to be true in the future. Maybe things are different now. But at least as a first exercise, it sounds like this is something we should understand, doesn't it?
As a first guess, we'll assume that these variances are going to be stable through time. So I want to know what I should do if I assume they are stable through time. That's the key idea. And that had not been worked out until Harry Markowitz developed the capital asset pricing model. in the early 1950s.
The Efficient Frontier: From Stocks and Bonds to More Assets
So what I want to do now is calculate the efficient portfolio frontier, which expresses the standard deviation of the portfolio in terms of R, the expected return on the portfolio, instead of X1. So here is an example of the efficient portfolio frontier. I calculated for two investments, US stocks and US bonds, using their historical expected returns, standard deviations, and covariances, variances and covariances.
So what we have on this axis is the standard deviation of return, and we have on this axis the expected annual return. So, and these are the possibilities. that we calculate with the formula. Let's consider a couple of special cases I have shown here. I could put all my assets into stocks, and then I would get an expected return equal to the return on stocks.
Or I could invest entirely in bonds, and I would be at this point here on the diagram. Bonds, these are long-term bonds, they're risky, because they're long term. Here, Professor Shiller mentions bonds are risky because they're long term. I wouldn't fixate too much on the use of the term bonds here. We're analyzing the efficient portfolio frontier with any two risky assets.
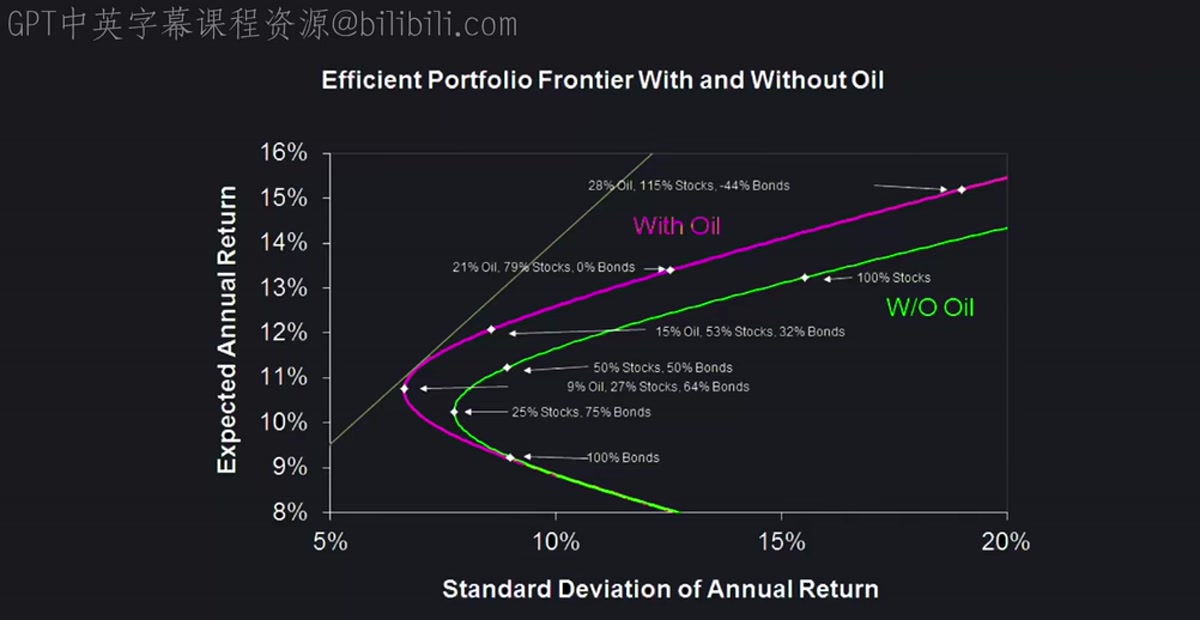
In this case, he chose the example of stocks and bonds to emphasize that they are two separate types of assets. You could easily replace the word stocks and bonds with Microsoft stock and Tesla stock, and the argument still works. have historically had a lower standard deviation of annual return, but also a lower expected return. So I could achieve that by putting all of my money in bonds, and I can achieve this by putting all of my money in stocks.
What if I put half my money in stocks and half in bonds, that puts me right here? So what we see is that there's an infinite number of money in stocks, an infinite number of possibilities. Oh, by the way, I could go more than 100% stocks. If you like, I could go out here. So that looks like it's something like 120% in stocks and minus 20% in bonds. So to do that, I'd have to short the bond market and buy the stock market.
I could do that. I can do anything. It's just those two formulas I just showed you, or the single formula for this curve. So what do you like? If you were investing your money, and I showed you this, what would you pick? Suppose you picked here, then another advisor would come up and say, you idiot, you could have picked up here, and then you would have gotten more return, and no difference in risk.
Shorting the stock market is risky. If it has a negative expected return, you don't want to do that. So what that means is that the whole curve here below the minimum variance point is dominated. It's called the dominated. You don't want to do that. don't ever want to be there. Well, what David Swenson says, you know who was there before he arrived? Yale University was there.
They had some fuddy-duddy investment advisors who would say, you know, we've advised endowments of portfolios over the years. And we find that for an institution like Yale University, they would do well to put their money in sound, safe, government bonds. And so. Actually, it wasn't David Swenson who first pointed out the foolishness of it. was starting to come in with the whole capital asset pricing model.
I think there was a Ford Foundation study of university endowments in the 60s that pointed out that universities are just stupidly putting their money in bonds. It used to be considered just smart. You know, it was almost like religion. You had to do things the right way. In Europe, a lot of foundations put all their money in bonds because that was supposed to be safe.
And then in Germany in the 1920s, there was a hyperinflation in 1923. Every foundation in Germany was completely wiped out by the hyperinflation. They should have thought of this. It wasn't safe. And they were undiversified. And they were doing the underperforming underdiversified asset. But it still takes a while. You know, you have a university corporations or boards tend to be filled with very old-fashioned educators.
They can't imagine putting money in the stock market. But David Swenson changed that. So you don't ever want to be down here. But you want to pick some point up here depending on your risk. And it's a matter of taste where along this frontier you choose to go. So here. now I have the same curve that I showed you before for stocks and bonds. And now let's add a third asset called oil.
I did this with actual variances and covariances when I did this diagram. Forget this diagonal line for the moment. Now I have three assets, stock bonds and oil. And so what is the minimum variance, minimum standard? I can get for any given expected return. And you can see that it gets more complicated now. The minimum variance portfolio, the minimum standard deviation portfolio, would be 9% oil, 27% stocks, and 64% bonds.
Up here, this is 21% oil, 79% stocks, 0% bonds. And here's 28% oil, 115% stocks, minus 44% bonds. All those things are possible. And so, now you might say, I should pick the minimum standard deviation, shouldn't I? Or is that right? Well, not generally, right? Because you're sacrificing some return for that. You have to pick a point that reflects your tastes.
So now that we're. added oil, you should not own a portfolio with just stocks and bonds in it. It's because the new portfolio frontier dominates. In other words, you can get the same return with the lower standard deviation. So putting, now oil is a risky asset, as you know recently. I've did this chart some years ago, so this is not updated. But what we're seeing lately confirms oil is risky.
It has, well, it was up to $150 a barrel or over that. in 2008, and now it's under $30 a barrel. It's jumping around wildly. So you might say, I'm going to stay away from oil. But the answer is, no, you shouldn't. You should have, you want everything in your portfolio. But maybe you want something like this point. So you're only 21% exposed to oil, 79% stock.
That sounds like a reasonable point. There are various possibilities here. but the point is you don't want to, you don't want to just invest in stocks and bond. Once you add oil, there's more opportunity to achieve expected return without risk. In today's economy, there's so much uncertainty, and many potential investors, I think, are fearful of getting involved in the market.
Is there a message that you think you would share with potential investors about? what's going on today with fluctuating markets and how to kind of continue to stimulate our economy? Well, it's going to be a mixed message. See, there is something inherently unsatisfying about investing in the stock market, because you're putting yourself on the line for risks in so many different ways that, and you can't possibly assess them all, risks of financial crisis, risks of, I would say, psychologically induced panics.
And so many people around the world have concluded, I'm just going to stay out of stocks, for example, because it's just a quagmire. I know that I can't figure out these investments, and people are trying to sell me on these. I don't trust them. So that creates an atmosphere that inhibits business. And business is ultimately the source of our prosperity. So I think, you know, the free market system that we have just kind of looks bad to a lot of people.
And you see people being taken advantage of sometimes. And you see people being taken advantage of sometimes. And you think there should be a purer system. That led a lot of people towards various forms of socialism. But on the other hand, it just seems like all the fun stuff is happening in capitalist countries. I don't know if they say capitalists, but countries that have markets and prices, and let people do things for themselves on their own initiative and suffer the consequences.
So the world has come in this direction. You can't really escape the fundamental problem that business involves intuitive judgment, risk taking. You'll never know all of the risks, you know, you have to at some point just think, hey, I'm just going to try it. And you might get a bad outcome. But I think what we've learned about human society is that As funny as this system looks, it's a good system.